SaaS / Payments Analytics · SaaS Platform
D2Metrics
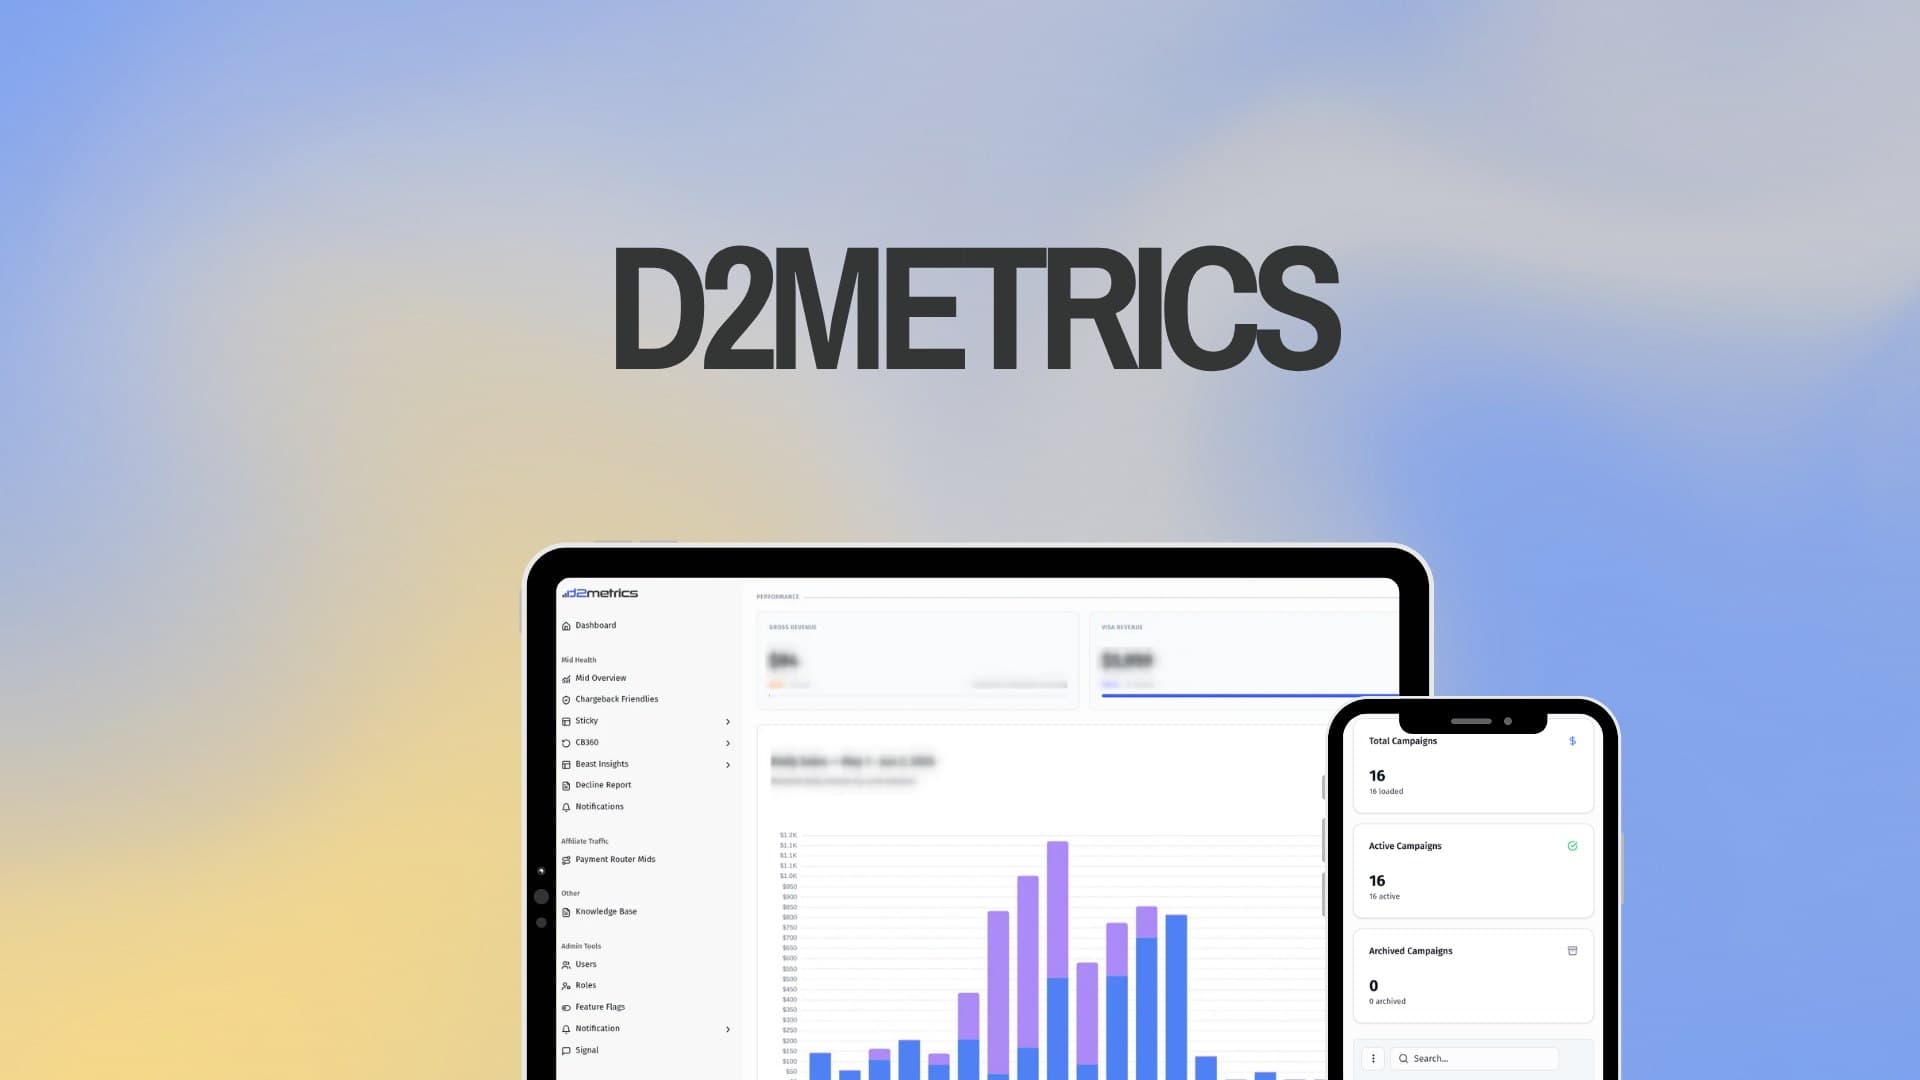
A SaaS analytics platform built from the ground up to replace four disconnected tools with one centralized dashboard, processing 20K-40K records a day with automated sync, granular permissions, and feature flags.
Challenge
The client's team was logging into four different platforms every day just to check basic revenue numbers, chargebacks, and processing status. There was no single source of truth, just browser tabs, manual copy-pasting, and numbers that were already stale by the time anyone acted on them. On top of unifying that data, the platform needed to handle real volume (roughly 20K-40K records a day) without dropping anything, enforce strict role-based access since the data involves sensitive payment and chargeback information, and let a non-technical admin turn features on or off without needing a new deployment every time.
Solution
I built D2Metrics from the ground up: a Next.js and Tailwind frontend, a NestJS backend with a PostgreSQL database, and BullMQ background jobs that pull, normalize, and sync data from every connected platform automatically. Every module (chargebacks, products, traffic, payment routing) reuses the same data table component, with filtering, search, and export built once and shared everywhere. On top of that, I built granular role-based permissions down to individual view, edit, and delete actions per module, a feature flag system so the client can toggle functionality without calling me for a deploy, and a full DigitalOcean deployment with Docker, Nginx, SSL, and separate staging and production environments, all released through GitHub Actions.
Project Overview
D2Metrics is a SaaS analytics platform built to help a business collect, manage, and analyze large volumes of payment and transaction data through one centralized, scalable web application.
I was responsible for the platform from the ground up: the complete frontend, the backend architecture, the database, automation, and the production infrastructure it all runs on.
The Challenge
Before D2Metrics, the client's management and ops teams were logging into four different platforms every single day just to check basic revenue metrics, cross-reference transaction histories, and see what was failing. There was no central source of truth, just endless browser tabs, manual copy-pasting, data lag, and confusion across the team.
Beyond simply unifying that data, the platform had real technical demands: it needed to process roughly 20,000 to 40,000 records a day without dropping anything, enforce strict role-based access since the data involves sensitive payment and chargeback information, and give a non-technical admin a way to control platform behavior without waiting on a new deployment.
The Solution
I engineered D2Metrics as a complete SaaS application rather than a UI wrapped around a few API calls. A Next.js and Tailwind frontend gives the team a responsive dashboard, a NestJS backend exposes RESTful APIs over a PostgreSQL database, and BullMQ handles background jobs and daily data synchronization so nothing depends on someone remembering to click refresh.
A Dashboard That Replaces Four Logins
The main dashboard unifies what used to be four disconnected data sources into one place: gross revenue, card-network splits, and daily transaction volume, all in real time instead of stitched together from separate tabs.
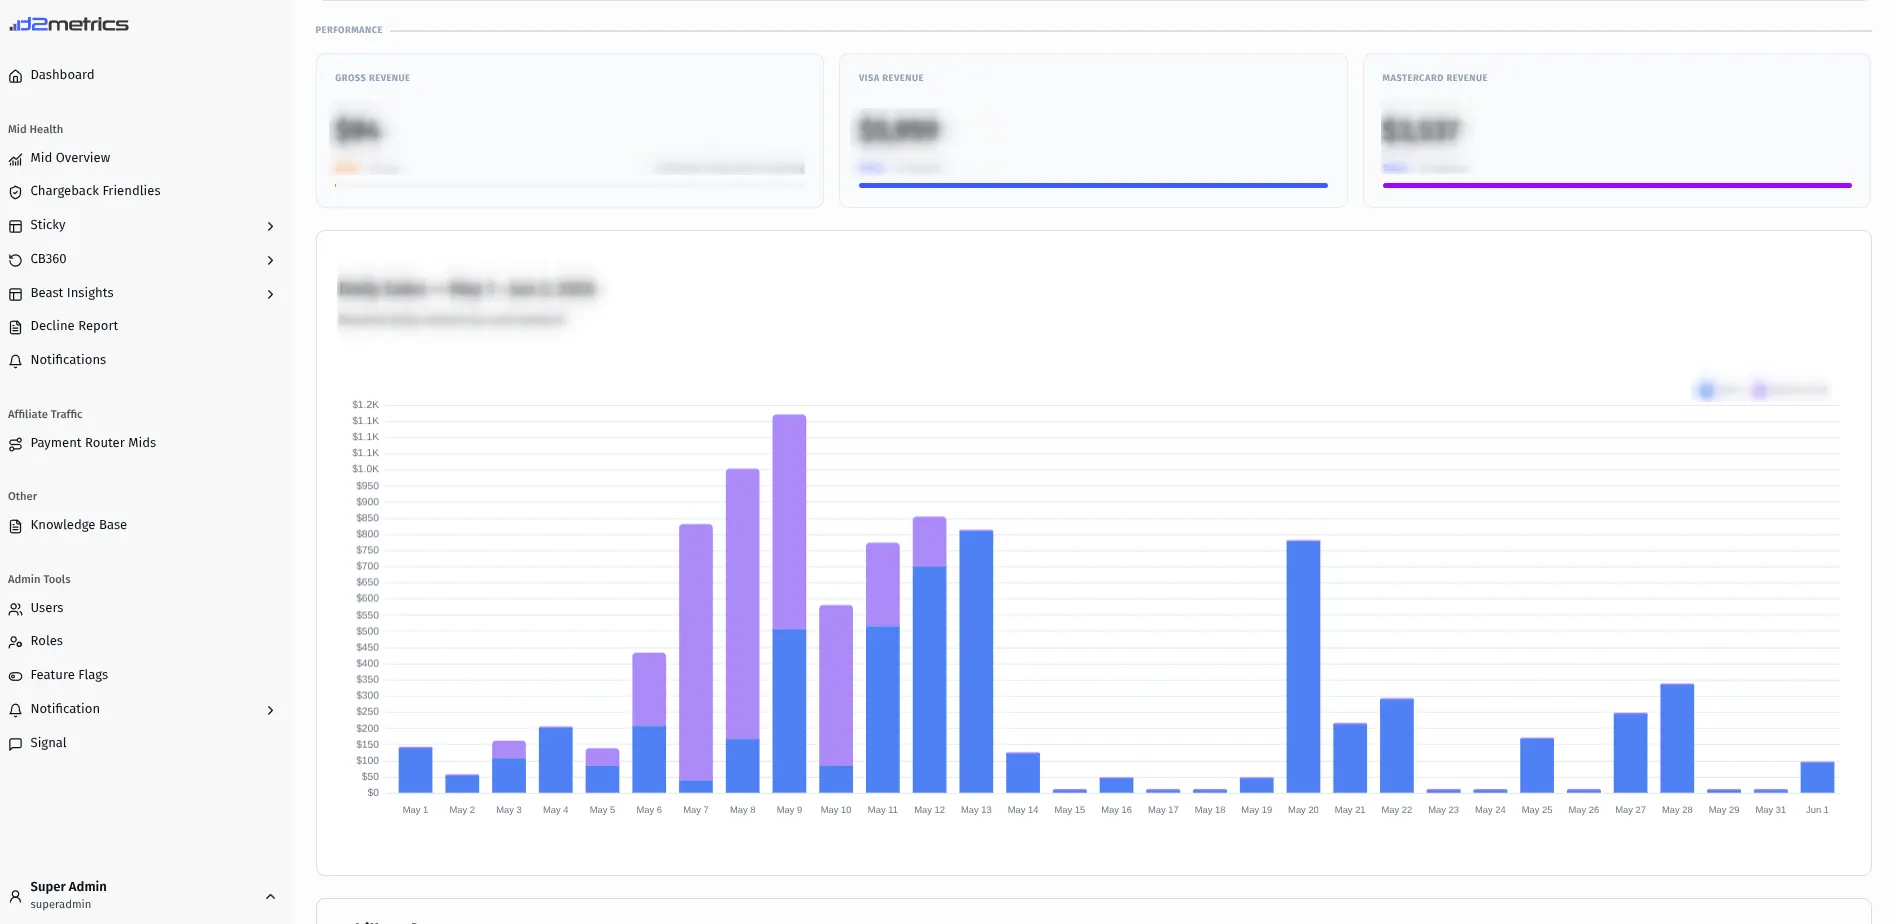
Building this meant the executive team could finally check business health from a single screen instead of reconciling numbers across four different logins by hand.
One Reusable Table, Every Data Type
Rather than building a custom table for every module, I built one reusable data table component, with search, date-range filtering, export, and fullscreen view, and reused it everywhere: chargeback analytics, product management, traffic, and payment routing all run on the same underlying component.

That reuse is what makes the "reusable components and services for faster future development" part of the brief real: a new data module doesn't mean a new table from scratch, it means plugging a new dataset into infrastructure that already works.
Granular Roles & Permissions
Because this platform handles sensitive payment and chargeback data, access control couldn't be an afterthought. Every role gets permissions broken down per module and per action, view, edit, and delete, individually, not just a blanket "admin" or "user" toggle.

A Super Admin can lock down or open up individual modules, like Chargeback Friendlies or Sticky.io Orders, for specific roles, so a support agent and a finance lead see very different, appropriately scoped versions of the same platform.
Feature Flags: Control Without A Deploy
To give the client real autonomy, I built an admin feature flag panel that controls platform functionality globally, grouped by module, with a simple on/off toggle for each one.
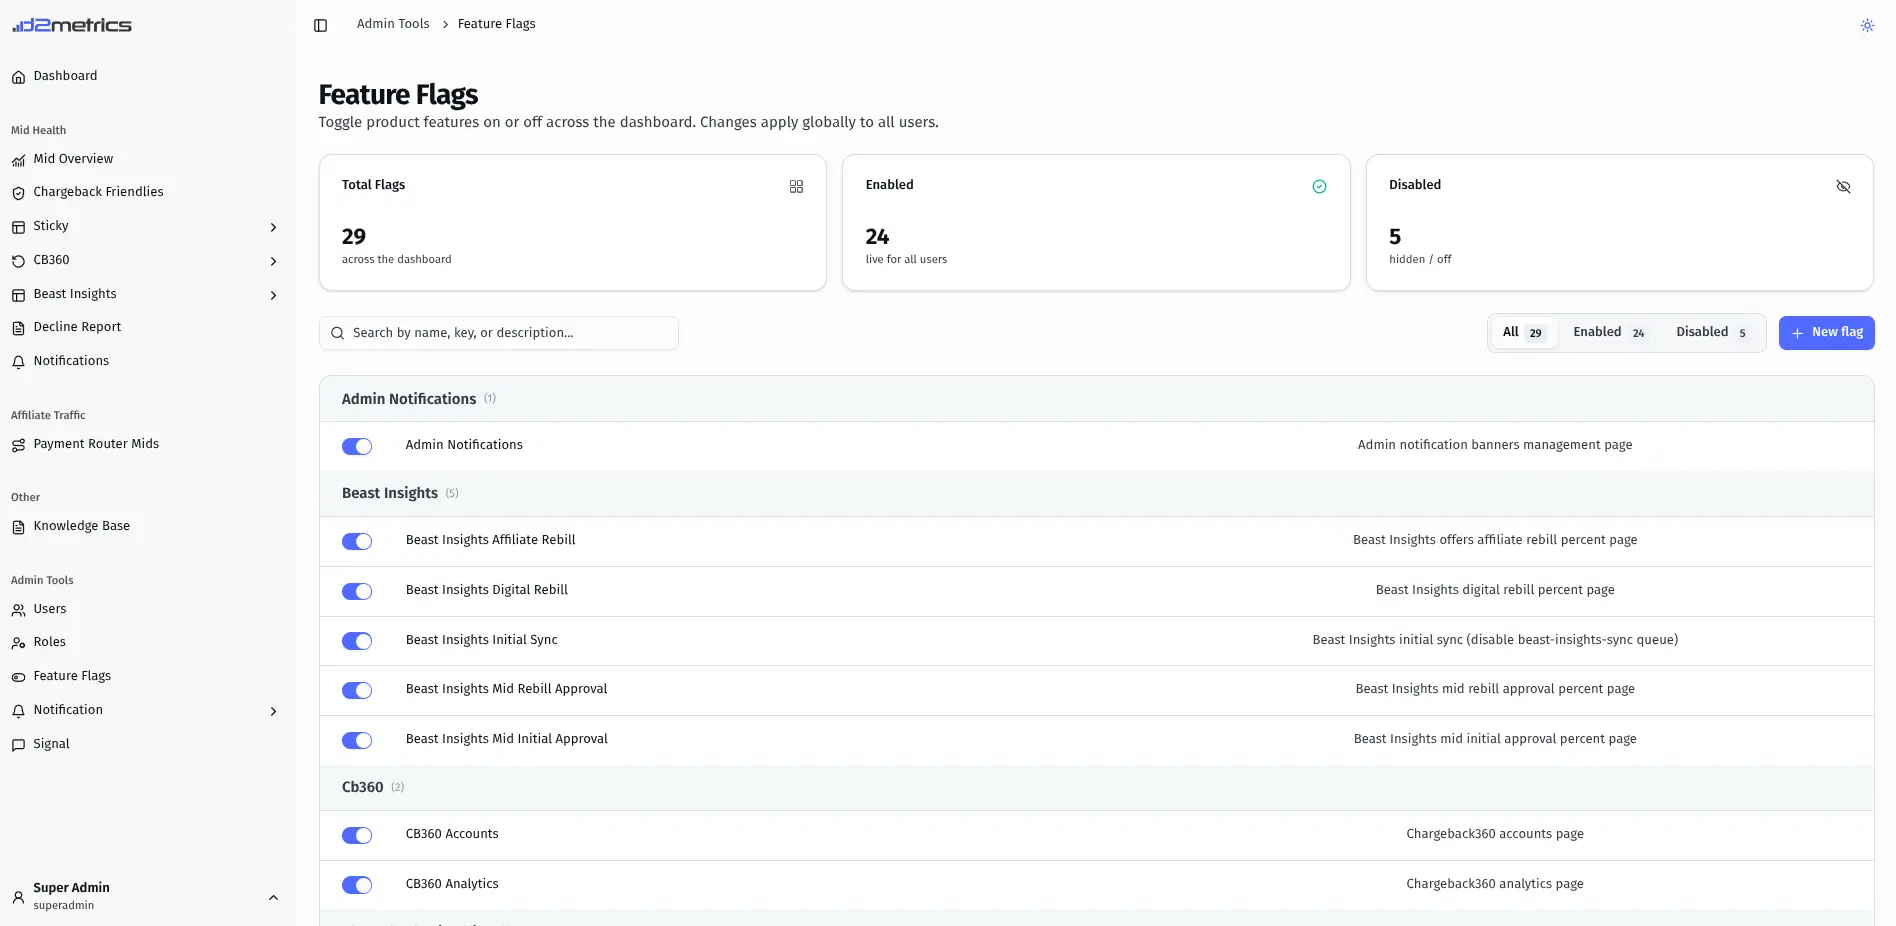
This means the client can turn a heavy feature or a background sync queue on or off across the entire platform in one click, without needing to ping me for a deploy.
Built For Real Volume
Behind every table and dashboard is a sync pipeline moving real volume, tens of thousands of records a day pulled from external platforms, normalized, and written to PostgreSQL through BullMQ background jobs. A visible "Last synced" timestamp and manual "Sync Now" control keep that process transparent instead of hidden.
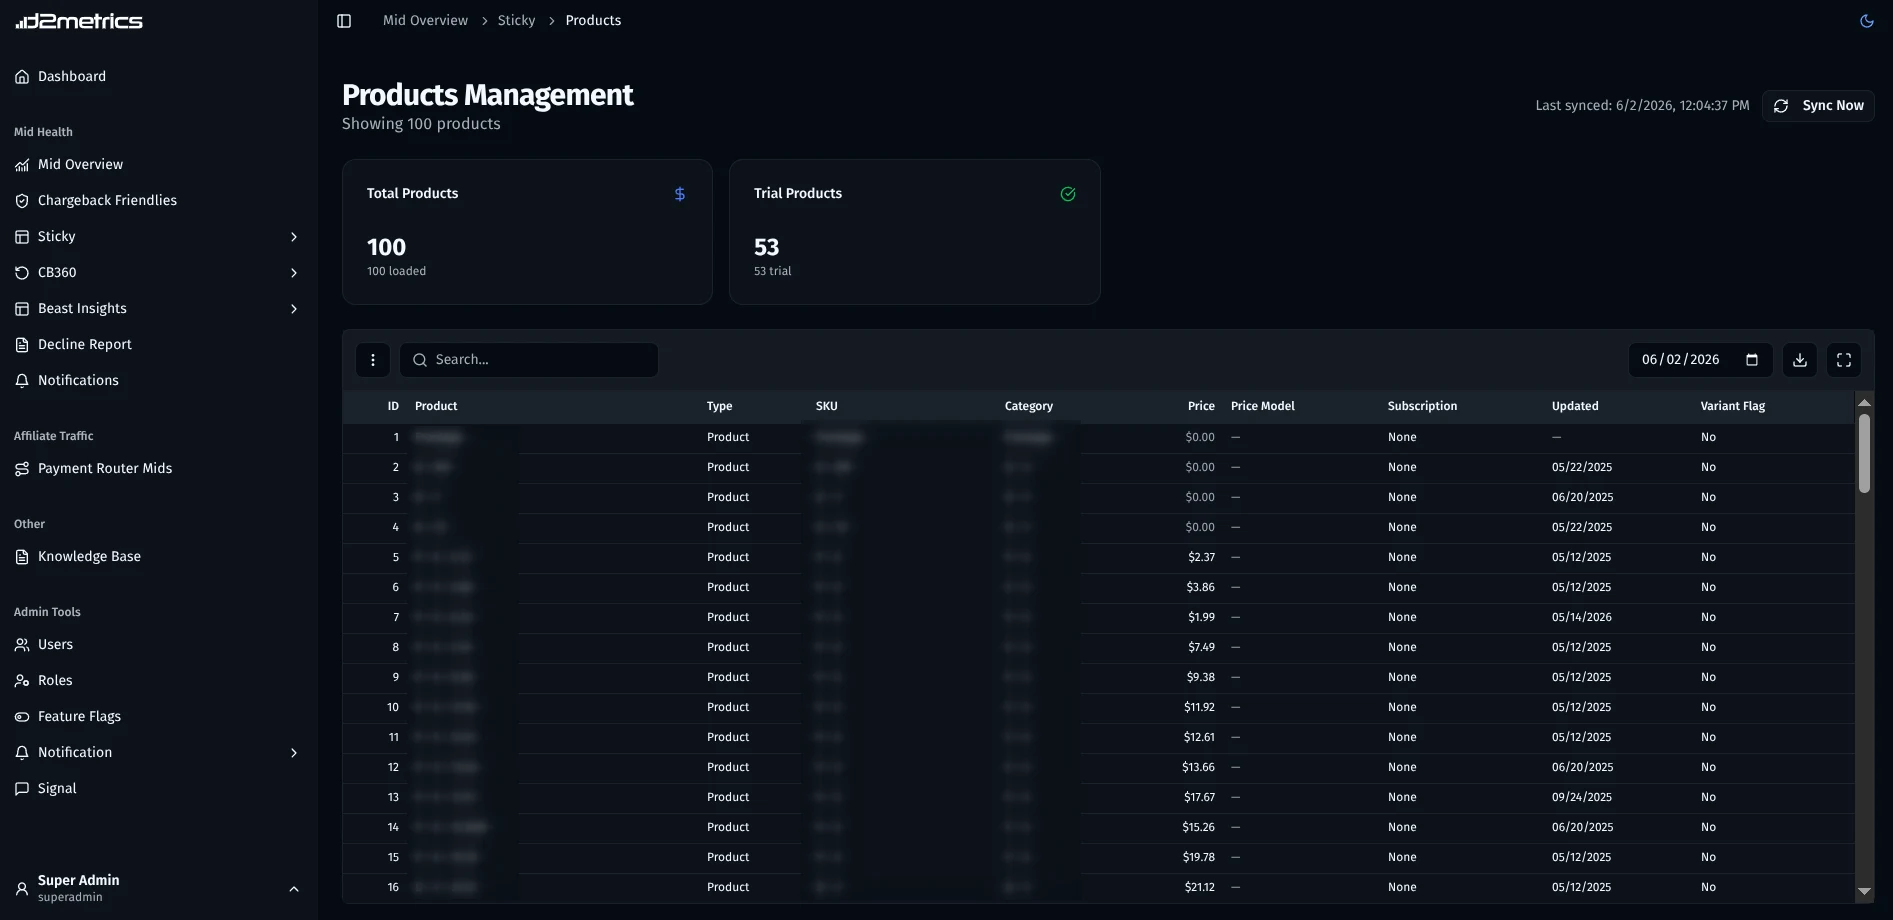
Running sync as background jobs instead of blocking requests means the dashboard stays responsive even while tens of thousands of records are being processed underneath it.
Infrastructure & CI/CD
None of this matters if it's fragile in production, so the platform runs on DigitalOcean behind Docker and Nginx, with Certbot-managed SSL and clearly separated staging and production environments. Environment variables and frontend-backend communication are configured explicitly per environment, not shared or guessed at.
Releases go through GitHub Actions pipelines that handle testing, builds, and deployment automatically, which turned what used to be manual, error-prone releases into a repeatable process that doesn't depend on remembering the right sequence of commands.
Content Structure
D2Metrics is organized around the modules a payments and ops team actually uses day to day.
The platform includes clear areas for:
- Real-time performance dashboard
- Mid health and chargeback analytics
- Affiliate and payment router traffic
- User, role, and permission management
- Feature flags and platform controls
- An embedded knowledge base
Structuring the platform this way meant new data modules could be added on top of existing table, permission, and sync infrastructure instead of each one becoming its own mini-project.
The Result
D2Metrics turned a daily routine of logging into four separate platforms into a single, centralized system that processes tens of thousands of records a day automatically. The team gets one dashboard instead of four, permissions that actually match how sensitive the data is, and the ability to control platform behavior themselves instead of waiting on a developer.
Key Takeaways
This project is a good example of what "full ownership" actually looks like on a SaaS build: not just the dashboard UI, but the database schema, the background job architecture, the permission model, and the infrastructure it all runs on.
For D2Metrics, that meant treating role-based access, feature flags, and reliable background sync as core architecture from day one, not features to bolt on after the demo looked good.
Results
- Replaced four disconnected platforms and manual copy-pasting with one centralized dashboard.
- Built automated background sync with BullMQ that pulls and normalizes roughly 20K-40K records a day without dropping data.
- Built one reusable data table component (filtering, search, export) shared across chargebacks, products, traffic, and payment routing modules instead of rebuilding it per module.
- Implemented granular role-based permissions down to individual view, edit, and delete actions per module.
- Built a feature flag panel so the client can toggle platform functionality on or off globally without a new deployment.
- Deployed to production on DigitalOcean with Docker, Nginx, and SSL, with separate staging and production environments.
- Built GitHub Actions pipelines for automated testing, builds, and deployments, cutting manual release work.